

Statistics show that about 39% of sales reps do not reach their goals every month, therefore, finding the right tool to achieve success becomes the most important issue on the agenda.
The problem is that the sales team members can’t easily get quick access to key relevant information to be able to close deals faster, get stalled deals back on track and see what activities bring the best results.
The use of dashboards with their «live reports» helps to effectively address this problem, increasing competition between sales teams, improving focus, and encouraging team spirit — and leading to increased sales.
1. What is a sales management dashboard?
A sales management dashboard is a visual representation of all the reliable sales data. The system captures all relevant data on a particular deal or account from various sources and presents it in an easy-to-understand and convenient form.
Using sales dashboards, sales management, sales ops, individual account executives, and other team members can:
- save time on collecting and processing data;
- manage business processes more efficiently;
- easily and quickly identify interdependencies between various metrics,
- spot trends;
- prevent potential problems.
This is the fastest method for obtaining and analyzing information.
Today, you can use multiple services that provide different ready-made quickbase dashboards and/or the ability to create your own, unique solutions. These can be tactical dashboards for managers or strategic dashboards for leaders — there are plenty of different types of them.
But, only you can decide which one is the best fit for your unique organization.
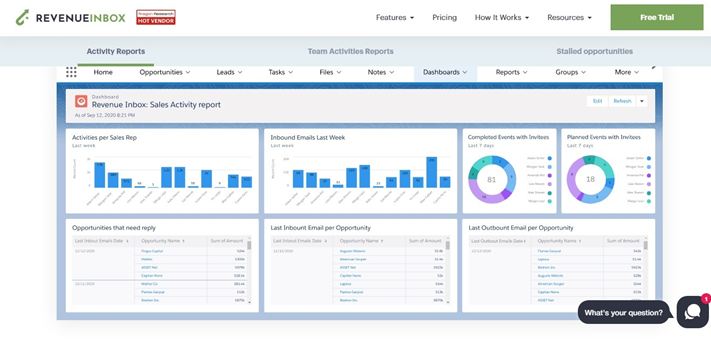
If you need an easy-to-use yet modern and effective solution, you should try the Revenue Grid's sales dashboard, which will allow you to strike a perfect balance between analyzing too few sales metrics and trying to monitor them all — with no extra costs involved.
Revenue Grid fully supports desktop, mobile, and cloud and offers 100% customizable Salesforce dashboards that provide quick & easy access and visibility of the key data that matters most to each specific user (based on personal preferences as well as job function), saving time and reducing the hassle.
Easily get your team activity reports, view how effectively your team is engaging with key deals, and make sure you can act fast on deals that matter most.
2. How do sales management dashboards help to increase sales?
2.1. Creating visibility
Today, information is the most important factor in an organization's operations. And the biggest problem of modern organizations is the difficulties that sales managers face when accessing data from various sources (CRM systems, MRP systems, spreadsheets, etc.).
Using a dashboard that combines disparate pieces of information into a coherent whole (in an accessible and convenient format), you get a visual representation of all the key data you need, creating a "360-degree" vision of your business.
You can easily use the Revenue Grid sales dashboards that work natively with Salesforce to track stalled opportunities and make sure to act fast on deals that matter most.
2.2. Taking advantage of data transparency
It is quite important to find out what things work well in the organization, but it is even more important to be aware of things that need to be improved right now. This helps to quickly diagnose problems in business processes and find the right solutions before everything falls apart.
Some of the most common problems include:
- low MRR;
- gaps in the sales funnel;
- slow response time to leads;
- underperforming sales reps;
- low performing sales activities.
For example, if there’s an issue in slow response time to leads, you should try to speed up the lead response time (for example, make it 5 minutes instead of 20).
As a result, the lead gets a quicker response and is more likely to become a customer. The company creates value and therefore is more likely to generate new recurring income.
2.3. Creating healthy competition
When your sales team members see the "live" results of their work (accessing it with their phones, tablets, laptops), it creates healthy competition in the team. The chance to get ahead of a colleague, win the highest sales, and get a bonus motivates employees a lot.
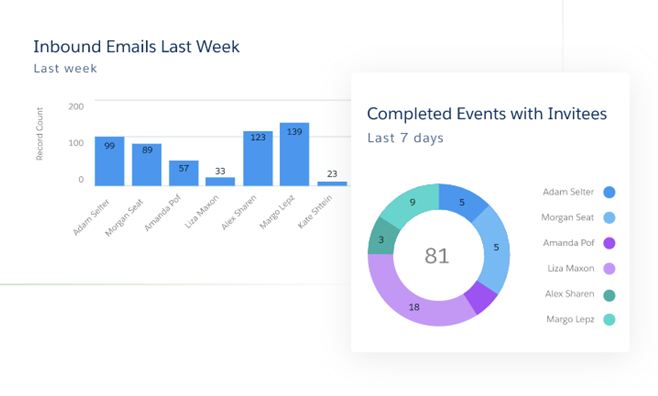
With the Revenue Grid sales dashboard, you can easily get team activity reports and forget about guessing who is your most proactive sales rep. Track inbound and outbound emails, tasks, calendar events, custom filters, inbound emails per team member, and many more right in a Salesforce tab.
2.4. Setting new objectives based on historical data
Using historical data, you can see if there are fluctuations during certain periods and take them into account ahead of time. You can also predict the likelihood of an increase in MRR by performance and setting specific levers.
If you tag certain target accounts in your CRM, you can track useful statistics in one place, for example:
- number of leads generated from them;
- amount of sales activity on these accounts;
- connection rate and account contacts;
- number of contacts engaged within the decision-making unit;
- lead scoring to evaluate the effectiveness of leads and pipeline opportunities;
- succession of these accounts through your pipeline;
- conversion rate you have against your target accounts;
- quarterly revenue generated from those accounts vs. forecast;
- predicted account revenue based on historic performance.
This approach allows you to understand what helps to drive uptake in response from your most relevant prospects, and make sure any investment your marketing department is making returns.
2.5. Using your time better
Dashboards help you to forget about writing everyday reports and focus on the most relevant data to solve problems as they arise:
- if sales rep falls behind, you can see it in the first week of the month and fix the problem;
- if the number of leads or traffic to your website has dropped in the last week, you can immediately find out the reason and do something about it;
- if leads aren't being tracked, you can nudge your team to respond before you lose opportunities.
2.6. Demonstrating results and increasing motivation
As a sales leader, it's important to praise and celebrate with your team or individuals when they are successful. With sales dashboard data, you can highlight sales metrics when:
- total revenue increases;
- win rate grows up;
- quota is attained;
- average deal size grows up;
- number of sales reps hitting their quota increases.
When high performing sales teams see how far they have come in meeting their goals, it drives them to set the bar higher.
For example, the Revenue Inbox sales dashboard’s opportunity engagement reports allow you to instantly check how well your team is engaging with key deals.
2.7. Focusing on the right sales metrics for success
Focus only on the metrics that matter at the moment. If cold emails lead to meetings, make sure open rates are significantly improving. If sales team members are closing 5% of quality phone conversations, set a goal to make 5 quality conversations per day.
In order to lead to business-critical goals, choose 2-3 metrics, and work with them, forgetting about the rest for a while.